When you try plotting on a graph Splunk metric split by a dimension with the same name (as the metric itself) will show NULL instead of the dimension.
The Problem
Let’s rewind a little.
Below is the payload that is sent to Splunk HEC and you will notice that there are 2 “statuses”:
-
"status": "success"– which is one of the dimensions and it can represent a collector/monitor status "metric_name:status": 0– which is the actual metric value that was collected by the collector/monitor
{
    "time": 1664970920,
    "event": "metric",
    "host": "host_5.splunk.com",
    "index": "d_telegraf_metrics",
    "fields": {
        "collector": "collector_a",
        "status": "success",
        "metric_name:query_time_seconds": 10.869,
        "metric_name:status": 0
    }
}
In the perfect world where you would probably rename one of these not to confuse the end-user in Splunk, but that (living in a perfect world) is not always the case.
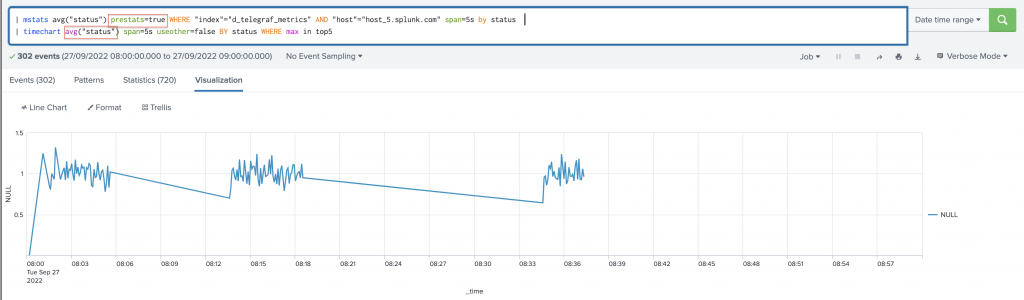
As a result, we end up with NULLs in the graphs 🙁
The Solution
Lucky for us Splunk’s search language (SPL) is very powerful and flexible and with two little modifications to the “original” SPL (that was produced by the Metrics Analyzer), we can solve the issue.
All you need to do is :
- instead of
prestats=truerename the metric function result usingascommand. - update the
avgfunction in thetimechartcommand to use the renamed field name.
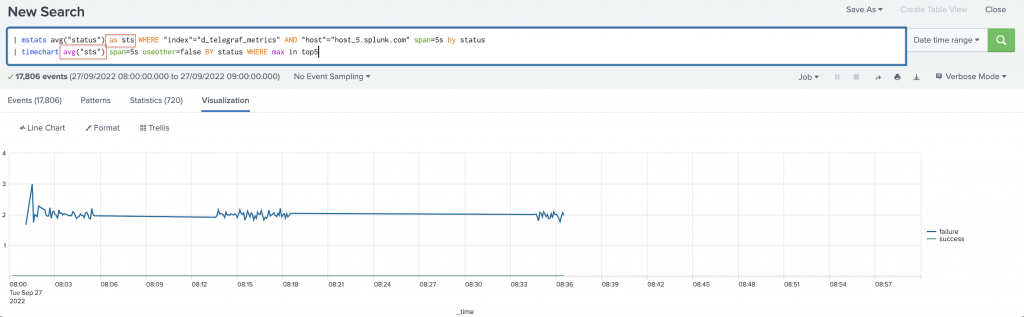
Original SPL:

Revised SPL:

The Result