Splunk has a predict command that can be used to predict a future value of a metric based on historical values. This is not a Machine Learning or an Artificial Intelligence functionality, but a plain-old-statistical analysis.
So if we have a single metric, based on historical results we can produce a nice prediction for the future (of definable span), but predicting multiple metrics in Splunk might not be as straightforward.
For example, I want to see a prediction for a used_pct metric for the next 30 days based on max daily reading for the last 30 days.
Easy (for a single metric/dimension):
Just get the metric (field) you want to predict into a timechart function and add the predict command followed by the field name (of interest) and the future_timespan parameter
| mstats max("latest_capacity|used_space") as used_space, max("latest_capacity|total_capacity") as total_capacity WHERE "index"="telegraf_metrics" "name"="vmware_vrops_datastore" sourcename=bla_vsan01 span=1d BY sourcename
| eval used_pct=round(used_space/total_capacity*100,2)
| timechart max(used_pct) by sourcename useother=false span=1d
| predict bla_vsan01 future_timespan=30
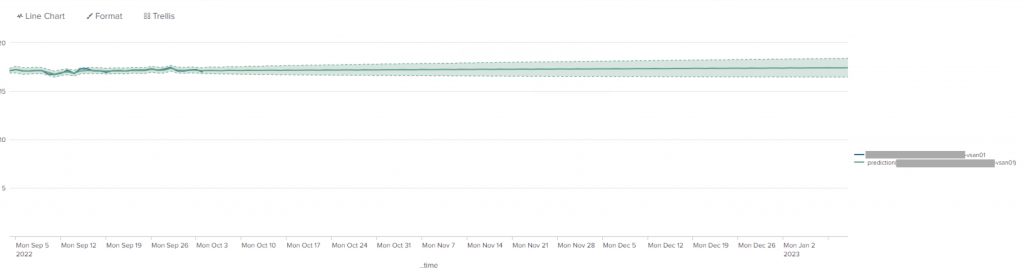
The resulting graph has the historical (last 30 days) reading (the wiggly line) and the prediction straight line with an average prediction with a “fan” upper/lower 95th percentile predictions.

BUT! “we don’t know how many storage instances we will have! we can’t just hardcode all the fields in the predict command or create a panel/search for each!”
I know, I know.
Predicting multiple metrics
Here it becomes a bit tricky. Remember that you need to specify all the fields you want to predict as part of predict command | predict MY_FIELD1, MY_FIELD2 ....
The way to deal with it is the map command https://docs.splunk.com/Documentation/Splunk/9.0.1/SearchReference/Map.
What it does, is executes an enclosed parametrised search command using provided parameters.
| mstats max("latest_capacity|used_space") as used_space WHERE "index"="telegraf_metrics" "name"="vmware_vrops_datastore" sourcename != "*local*" span=1d BY sourcename
| stats values(sourcename) as sourcename
| mvexpand sourcename
| map
    [| mstats max("latest_capacity|used_space") as used_space, max("latest_capacity|total_capacity") as total_capacity WHERE "index"="telegraf_metrics" "name"="vmware_vrops_datastore" sourcename=$sourcename$ span=1d by sourcename
    | eval used_pct=round(used_space/total_capacity*100,2)
    | timechart max(used_pct) span=1d by sourcename useother=false limit=0
    | predict $sourcename$ future_timespan=30
        ] maxsearches=30
The first part of the SPL (|mstats until the | map) is used to prepare a list of sourcenames (storages) that will be passed instead of the $storename$ parameter.
The second part is the same SPL from before, where literal sourceneme was tokenised.
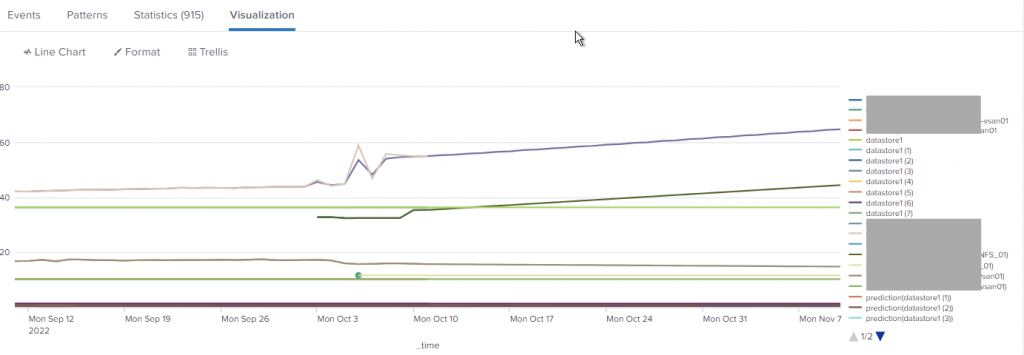
Here is the visualisation of the above SPL using the “Line Chart” option:
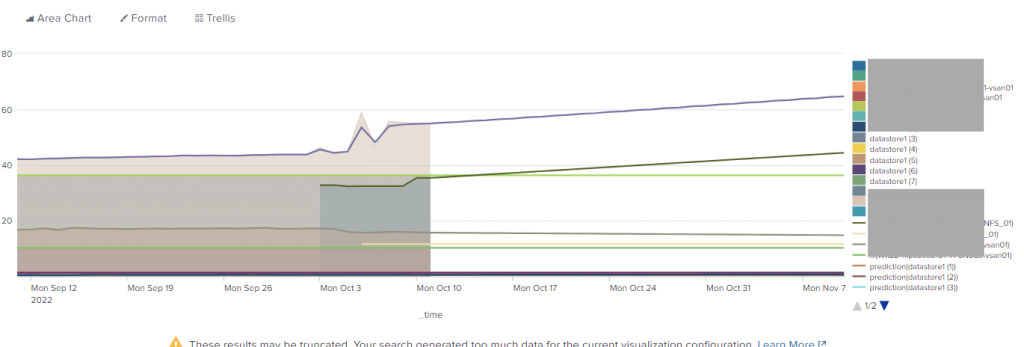
I personally find the same visualisation a bit more readable when using an “Area Chart”
The actual measurements are visualised using the shaded areas, while the predictions are drawn using lines
Some thoughts about putting it all in a dashboard
- Save the search as a saved search that will run hourly or maybe even daily. Then update the SPL to load results from the saved search. Pass
<USER>:<APP>:<SAVED_SEARCH_NAME>to theloadjobcommand
| loadjob savedsearch="admin:my_app:vmware_vrops_datastore usage prediction"
- Add a dropdown selector to allow us to either see all storages or focus on single storage at a time and update the SPL with tokens
| fields + _time $tkn_datastore$, prediction($tkn_datastore$), lower95(prediction($tkn_datastore$)), upper95(prediction($tkn_datastore$))
- add static “threshold” lines by adding below to the SPL
| eval WARN=70, ERROR=90
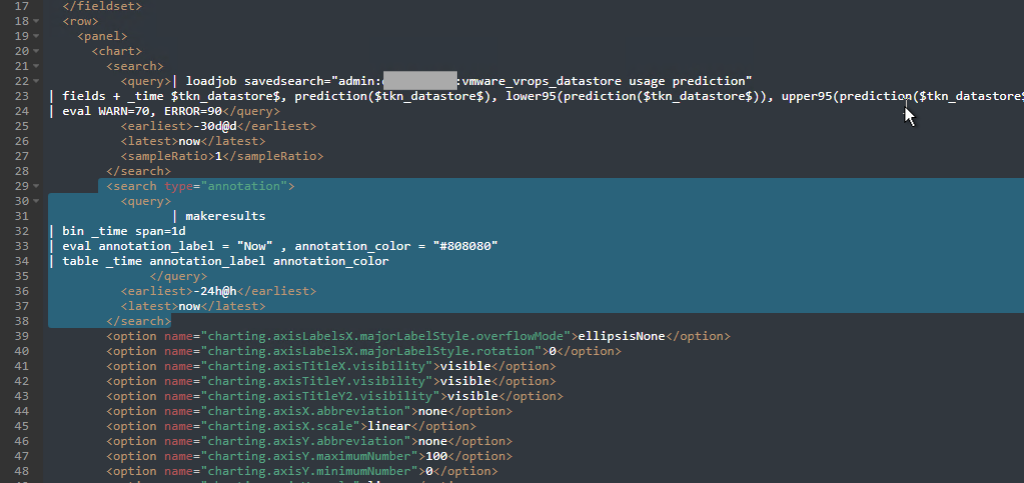
The resulting SPL:
| loadjob savedsearch="admin:def_sahara:vmware_vrops_datastore usage prediction"
| fields + _time $tkn_datastore$, prediction($tkn_datastore$), lower95(prediction($tkn_datastore$)), upper95(prediction($tkn_datastore$))
| eval WARN=70, ERROR=90
- and maybe add an annotation “tick” to show when is “now”, which will indicate that everything before (left of it) was collected data and everything after (right of it) is a prediction. That is done by adding the following
<search type="annotation">section to the XML of the panel.
<search type="annotation">
  <query>
| makeresults
| bin _time span=1d
| eval annotation_label = "Now" , annotation_color = "#808080"
| table _time annotation_label annotation_color
  </query>
  <earliest>-24h@h</earliest>
  <latest>now</latest>
</search>
if you have too many storages the graph might become unreadable, so one of the options will be first to pre-calculate the predictions, and then chart only the metrics that are predicted to cross a threshold.
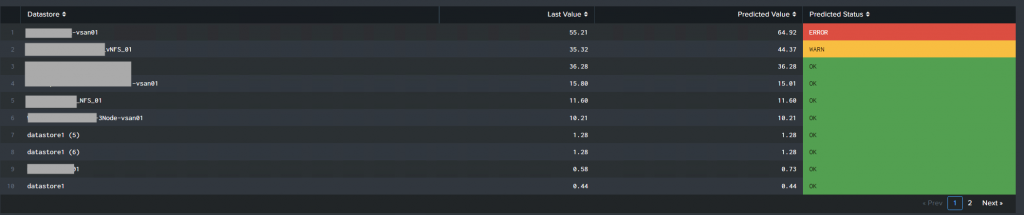
Another option will be to show all our “final” predictions in a table format (instead of the timechart)
| loadjob savedsearch="admin:my_app:vmware_vrops_datastore usage prediction"
| fields - upper*, lower*
| stats latest(*) as current_*
| transpose
| rename "column" AS m, "row 1" AS r
| eval r = round(r,2)
| rex field=m "(?:(current_prediction\((?<datastore_name_predict>.*)\))|(current_(?<datastore_name_current>.*)))"
| eval datastore_name=coalesce(datastore_name_predict, datastore_name_current), r_type = if(isnull(datastore_name_predict),"current","prediction")
| stats values(r) as r by datastore_name, r_type
| xyseries datastore_name, r_type, r
| eval WARN=40, ERROR=60
| eval status = if(prediction > ERROR,"ERROR",if(prediction > WARN, "WARN","OK"))
| sort - prediction
| fields - ERROR, WARN
| table datastore_name, current, prediction, status
| rename datastore_name AS "Datastore", current as "Last Value", prediction as "Predicted Value", status as "Predicted Status"
More posts about Splunk
Send Claude Code and Codex logs to Splunk
Add new LLM models to Splunk MLTK
Splunk Failed to apply rollup policy to index… Summary span… cannot be cron scheduled
How to collect StatsD metrics from rippled server using Splunk
Plotting Splunk with the same metric and dimension names shows NULL
Splunk Eventgen Jinja templating
How to Register to Splunk Partner Portal and transfer Certifications and Learning