I wanted my coding agents (Claude Code and Codex) to speak to me.
Not constantly. Not with a voice assistant persona. Just a short spoken summary when a completed turn arrived, so I could keep working without staring at the terminal.
Both Codex and Claude Code already emit useful telemetry. OpenTelemetry was already present in the workflow. The slightly unreasonable solution was to route that telemetry into a small local speech service.
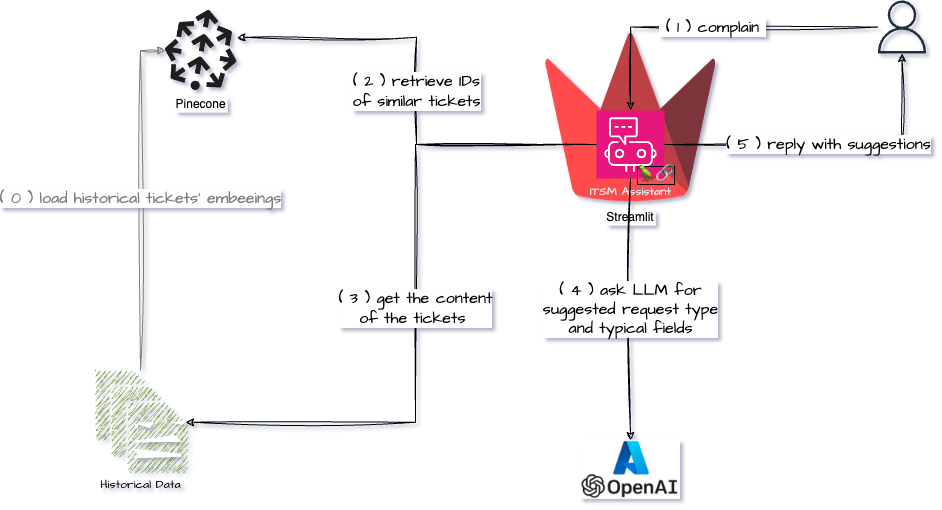
The result looks like this:
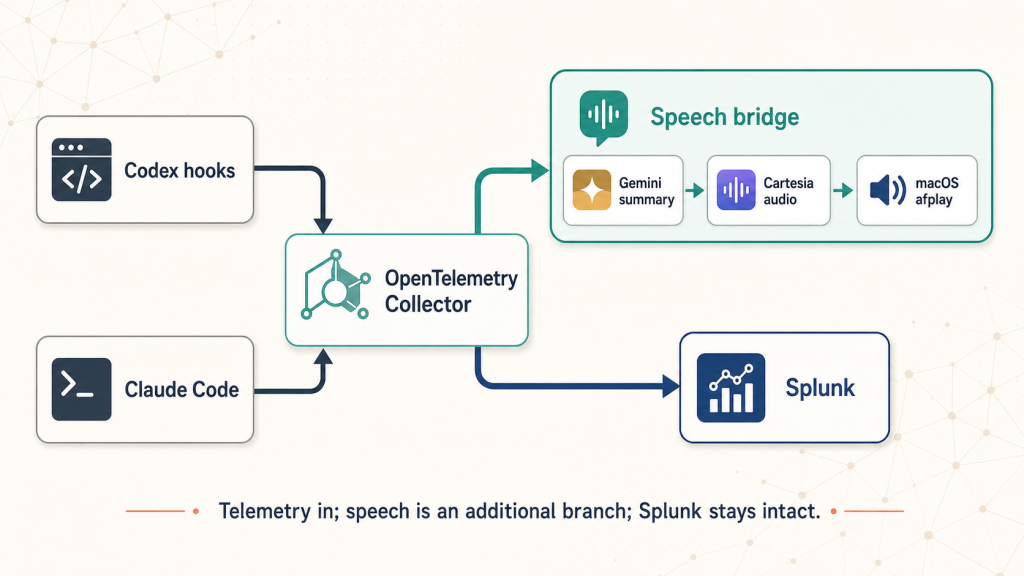
The Collector remains the central routing point. Splunk’s existing exporters stay intact. Speech is an additional filtered branch.
Read more: How I (ab)used OpenTelemetry to make Claude Code and Codex speak to meThe basic idea
The speech bridge is a small FastAPI service.
It accepts authenticated OTLP/HTTP protobuf logs and traces, correlates them into completed agent turns, summarises the turn with Gemini, generates audio through Cartesia, writes the returned WAV bytes to a temporary file, and plays them sequentially with macOS afplay.
You can find the code on GitHub.
Getting events out of the agents
For Codex (as it doesn’t emit its response via OTEL), I used lifecycle hooks.
The prompt event is sent when a prompt is submitted:
printf '%s\n' \
  '{"session_id":"synthetic-codex","turn_id":"turn-1","prompt":"Add tests"}' \
  | python3 scripts/codex_otel_hook.py UserPromptSubmit
The final response is sent on stop:
printf '%s\n' \
  '{"session_id":"synthetic-codex","turn_id":"turn-1","last_assistant_message":"Tests added"}' \
  | python3 scripts/codex_otel_hook.py Stop
The hook does not send directly to the speech service. It sends unauthenticated OTLP to the local Collector:
http://127.0.0.1:4318/v1/logs
The Collector then routes the relevant records to the authenticated speech exporter.
For Claude Code, I used its prompt and assistant-response events together with enhanced OTLP traces. Claude’s event model is slightly different, so the speech bridge accepts both logs and traces.
The important point is that the agent does not need to know that speech exists. It just emits telemetry.
The Collector configuration
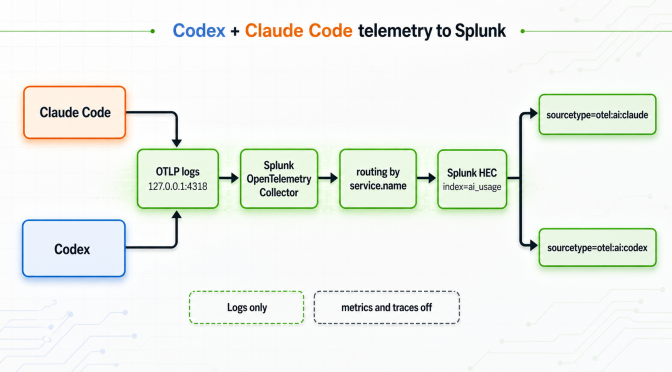
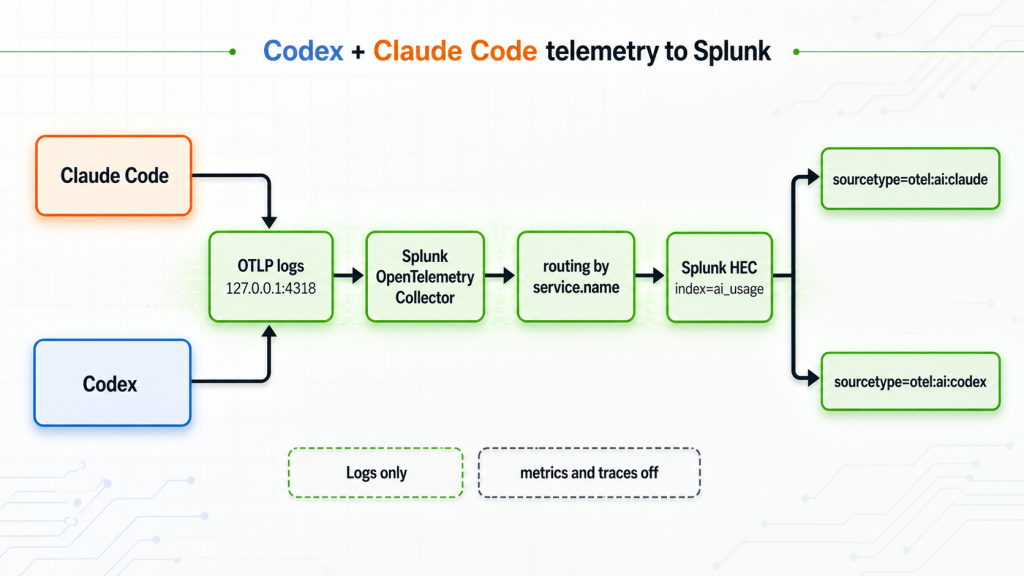
The agents do not send directly to the speech bridge. They send ordinary OTLP to the local OpenTelemetry Collector. The Collector keeps Splunk working as before, filters events by agent, and adds speech as a separate authenticated branch.
The configuration below is additive. It belongs in the existing Collector configuration (as described in Send Claude Code and Codex logs to Splunk); it is not a complete replacement for agent_config.yaml.
exporters:
  otlp_http/speech/codex:
    endpoint: http://host.docker.internal:17860
    headers:
      x-speech-ingest-token: "${SPEECH_INGEST_TOKEN}"
    sending_queue:
      enabled: true
      num_consumers: 1
      queue_size: 10000
    retry_on_failure:
      enabled: true
      initial_interval: 1s
      max_interval: 10s
      max_elapsed_time: 0s

  otlp_http/speech/claude:
    endpoint: http://host.docker.internal:17860
    headers:
      x-speech-ingest-token: "${SPEECH_INGEST_TOKEN}"
    sending_queue:
      enabled: true
      num_consumers: 1
      queue_size: 10000
    retry_on_failure:
      enabled: true
      initial_interval: 1s
      max_interval: 10s
      max_elapsed_time: 0s

processors:
  filter/drop_claude_logs:
    error_mode: ignore
    logs:
      log_record:
        - resource.attributes["service.name"] == "claude_code"
        - resource.attributes["service.name"] == "claude"
        - resource.attributes["service.name"] == "claude-code"

  filter/drop_non_claude_logs:
    error_mode: ignore
    logs:
      log_record:
        - resource.attributes["service.name"] != "claude_code" and resource.attributes["service.name"] != "claude" and resource.attributes["service.name"] != "claude-code"

  filter/drop_non_claude_traces:
    error_mode: ignore
    traces:
      span:
        - resource.attributes["service.name"] != "claude_code" and resource.attributes["service.name"] != "claude" and resource.attributes["service.name"] != "claude-code"

  batch/speech:
    timeout: 1s

service:
  pipelines:
    logs/codex:
      receivers: [otlp]
      processors: [filter/drop_claude_logs, transform/normalize, batch]
      exporters: [splunk_hec/codex, otlp_http/speech/codex]

    logs/claude:
      receivers: [otlp]
      processors: [filter/drop_non_claude_logs, transform/normalize, batch]
      exporters: [splunk_hec/claude, otlp_http/speech/claude]

    traces/claude:
      receivers: [otlp]
      processors: [filter/drop_non_claude_traces, batch/speech]
      exporters: [otlp_http/speech/claude]
The existing Collector already provides the otlp receiver, the Splunk exporters, transform/normalize, and the regular batch processor. This chapter only adds the speech-specific pieces.
What the pipelines do
The Codex pipeline drops known Claude service names, then sends the remaining logs to both Splunk and the Codex speech exporter. The Claude pipeline does the inverse. The accepted names are claude, claude_code, and claude-code because different Claude Code versions report different values.
The Claude trace pipeline applies the same filter to spans. Those traces help the bridge correlate a completed Claude turn. The separate speech exporters keep the Codex and Claude delivery queues independent.
The exporter endpoint is a base URL. OTLP/HTTP sends logs to /v1/logs and traces to /v1/traces. host.docker.internal is the Docker Desktop hostname that lets the Collector container reach the host-native FastAPI service.
Authentication and failure boundaries
The hooks send unauthenticated OTLP to the local Collector. The Collector adds x-speech-ingest-token when forwarding to the bridge. The token must be available inside the Collector container and must never be committed or printed.
services:
  splunk-otel:
    environment:
      - SPEECH_INGEST_TOKEN=${SPEECH_INGEST_TOKEN}
If the Collector cannot reach the bridge, its exporter queue retries delivery. If the bridge accepts the event but Gemini, Cartesia, or afplay fails, the speech worker increments failed, calls task_done(), and continues with the next FIFO item.
Validate before restarting
Validate the merged configuration before recreating the Collector:
docker compose --env-file /Users/ir/.config/otel2speech/collector.env -f /Users/ir/workspaces/splunk-pai-demo/docker/docker-compose.yaml config --quiet

docker compose --env-file /Users/ir/.config/otel2speech/collector.env -f /Users/ir/workspaces/splunk-pai-demo/docker/docker-compose.yaml up -d --force-recreate splunk-otel
The repository keeps this additive configuration in config/collector-speech-snippet.yaml. It is intentionally a snippet because the existing Collector configuration contains the Splunk receivers, exporters, and environment-specific settings.
Correlation is the real problem
Text-to-speech is easy.
Knowing when there is something worth speaking is harder.
Agent telemetry can arrive out of order. A response can arrive before the root trace. Multiple turns can be interleaved in the same session. There are also subagent and tool events that should not become spoken announcements.
The bridge therefore has a small in-memory correlator.
It tracks:
- source;
- session ID;
- turn ID;
- prompt;
- final response;
- trace and span identifiers;
- timestamps;
- whether the event belongs to the main agent.
A turn is emitted only when the required pieces are present. For Claude, the completed root span helps anchor the turn. For Codex, the prompt and final response lifecycle events provide the boundary.
The correlator also deduplicates events and filters out irrelevant agent activity.
One FIFO worker
Once a completed turn is emitted, it goes into one unbounded FIFO queue.
The worker processes exactly one turn at a time:
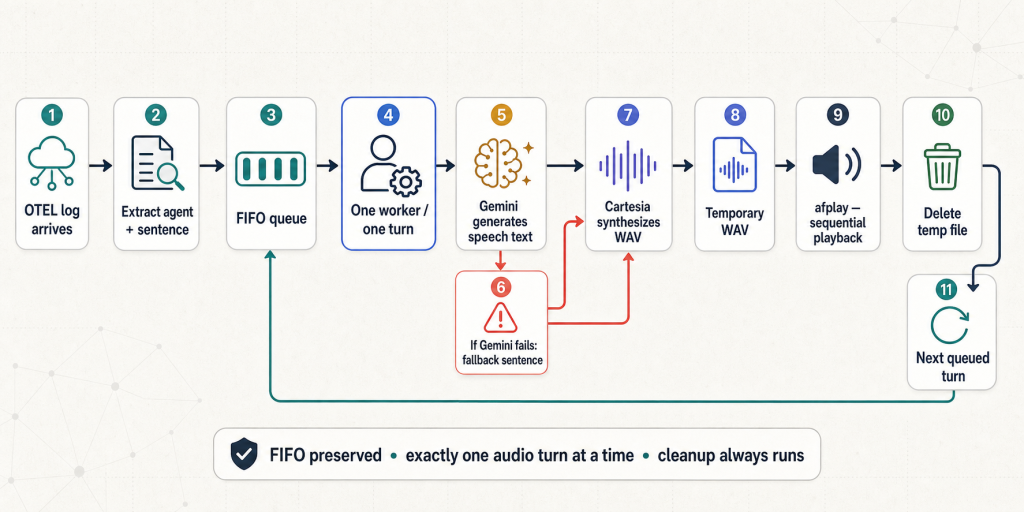
Sequential playback matters. If two agent turns complete close together, the audio should not overlap or race.
The worker also treats each turn as isolated work. A failure must not terminate the loop or prevent later turns from being spoken.
The statistics are deliberately simple:
enqueued: normalised turns accepted;completed: successfully delivered turns, including dry-run;failed: turns where generation or delivery failed;last_source: source of the latest successful turn.
Every queue item calls task_done(), including failures.
Gemini is optional, but Cartesia is not
Gemini generates a short spoken summary of the completed turn.
The prompt asks for plain spoken language without Markdown or raw prompt quoting. It targets 20–30 words, but accepts any non-empty valid sentence within the configured maximum.
If Gemini is unavailable, lacks credentials, times out, or returns invalid output, the bridge uses a fixed fallback sentence:
Completed turn received and queued for speech; review the result when convenient, then continue with the next planned action safely.
That fallback is still sent through Gemini’s normal downstream path:
fallback sentence → Cartesia → afplay
This distinction matters. Gemini is a summary provider. It is not an audio backend.
Cartesia is the only speech synthesiser
The final design has one synthesis backend: Cartesia.
Codex and Claude retain distinct Cartesia voice IDs. Both use a Cartesia speed of 1.3 through SPEECH_RATE.
Cartesia returns audio bytes. The bridge writes those bytes to a temporary WAV file and calls:
afplay /path/to/temporary.wav
afplay is only a playback mechanism. It does not synthesise speech.
The temporary file is deleted in a finally block whether playback succeeds or fails.
There is no local macOS voice-synthesis fallback anymore. That makes failure behaviour much easier to reason about:
- missing Cartesia credentials: delivery fails;
- Cartesia request failure: delivery fails;
- empty Cartesia audio: delivery fails;
afplayfailure: delivery fails;- worker increments
failedand continues to the next FIFO item.
No alternate speech synthesis is attempted.
Keeping logs content-free
The bridge handles prompt and response text in memory while correlation and speech work are pending.
Application logs contain source names, counts, backend names, and failure categories. They do not log raw prompts, responses, or generated speech text.
This is particularly important because OTEL pipelines often contain full-content telemetry. The Collector configuration should be reviewed carefully, especially when adding new exporters.
The speech branch should be filtered and isolated. Splunk’s existing full-content exporters should remain intact.
Running it
The setup is intentionally manual:
uv sync
cp .env.example .env
uv run python scripts/ensure_shared_token.py
uv run uvicorn app.main:app --host 0.0.0.0 --port 17860
The important configuration is roughly:
SPEECH_INGEST_TOKEN=replace-with-a-long-random-token

GEMINI_API_KEY=
GEMINI_MODEL=gemini-3.5-flash

CARTESIA_API_KEY=
CARTESIA_MODEL=sonic-3.5
CARTESIA_CONTAINER=wav

SPEECH_RATE=1.3

CODEX_CARTESIA_VOICE_ID=...
CLAUDE_CARTESIA_VOICE_ID=...
Secrets stay in ignored environment files. The repository does not contain API keys or ingest tokens.
Why abuse OpenTelemetry this way?
This is not a conventional voice-agent architecture.
It is a small adapter built on top of telemetry that already exists. The agents produce lifecycle events, the Collector provides routing, and the speech bridge turns selected completed events into audio.
The advantages are practical:
- no agent-specific speech integration;
- no changes to the agent’s core execution loop;
- existing session and trace identifiers provide correlation;
- Collector routing keeps the speech service separate from the agents;
- the same telemetry can continue flowing to Splunk.
The tradeoffs are equally clear:
- the queue is in memory;
- restarting the bridge loses pending work;
- speech depends on network access to Gemini and Cartesia;
- playback is macOS-specific;
- telemetry ordering and filtering require careful testing.
For a production system, I would probably add durable state, explicit event schemas, retries, health metrics, and a proper audio service.
For a local coding workflow, this is enough.
OpenTelemetry was already telling me what the agents had done. I just gave it a voice.
Find the code on https://github.com/ilyaresh/otel2speech