The XRP Ledger (XRPL) is a decentralized, public blockchain and rippled server software (rippled in future references) powers the blockchain. rippled follows the peer-to-peer network, processes transactions, and maintains some ledger history.
rippled is capable of sending its telemetry data using StatsD protocol to 3rd party systems like Splunk.
Overview
Prerequisites – rippled and Splunk are installed
Configure Splunk – Configure indexes and Inputs in Splunk
Configure rippled – Configure rippled to send metrics
View rippled metrics in Splunk – enjoy the fruits of your labour 🙂
Prerequisites
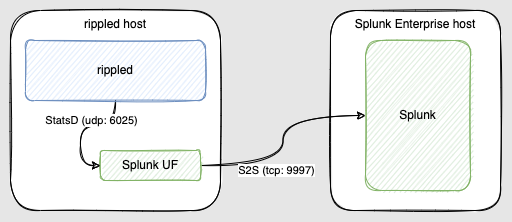
Since we are talking about collecting data from the rippled servers into Splunk Enterprise (or simply “Splunk” in future references) it will make sense that we need these 2 pieces of software running.
As a rule of thumb, rippled and Splunk Enterprise should not be running on the same machine unless it’s a dev environment.
- Follow the official guides from XRPL.org to install rippled server
- Follow Splunk’s official docs to install Splunk Enterprise.
- If you are using 2 separate machines to run rippled and Splunk, install Splunk Universal Forwarder (UF) on the rippled server machine
Make sure that there is network connectivity from UF to Splunk Enterprise over port 9997 (default port for Splunk-to-Splunk data flow) and 8089 (optional if you intend to use Splunk Deployment Server functionality, which I will not dive into in this post).
Configure Splunk
Splunk Enterprise
Create a new Metrics index, either in Splunk UI or in indexes.conf .
[xrpl_metrics]
coldPath = $SPLUNK_DB/xrpl_metrics/colddb
homePath = $SPLUNK_DB/xrpl_metrics/db
thawedPath = $SPLUNK_DB/xrpl_metrics/thaweddb
datatype = metric
If using UF to send data, enable TCPinput in Splunk UI or in inputs.conf
[splunktcp://9997]
Spunk UF
I’m using UF in my deployment, as it will not only collect telemetry data, but also the rippled logs.
Configure inputs.conf to listen to StatsD feed that will be coming out of rippled
[udp://6025]
connection_host = none
index = xrpl_metrics
sourcetype = statsd
Configure outputs.conf for UF to send data to Splunk (if that is not already configured)
[tcpout]
defaultGroup = primary_indexers
forceTimebasedAutoLB = true
forwardedindex.2.whitelist = (_audit|_introspection|_internal)

[tcpout:primary_indexers]
server = splunk_entterprise_server:9997
Configure rippled
Add the following stanza to your rippled.cfg (located by default in /opt/rippled/etc folder)
[insight]
server=statsd
address=127.0.0.1:6025
prefix=rippled
Restart rippled server [sudo] systemctl restart rippled.service
View rippled metrics in Splunk
If you will use the index name as in this post, your rippled StatsD metrics will be visible in the xrpl_metrics index. You can preview them:
| mpreview where index=xrpl_metrics
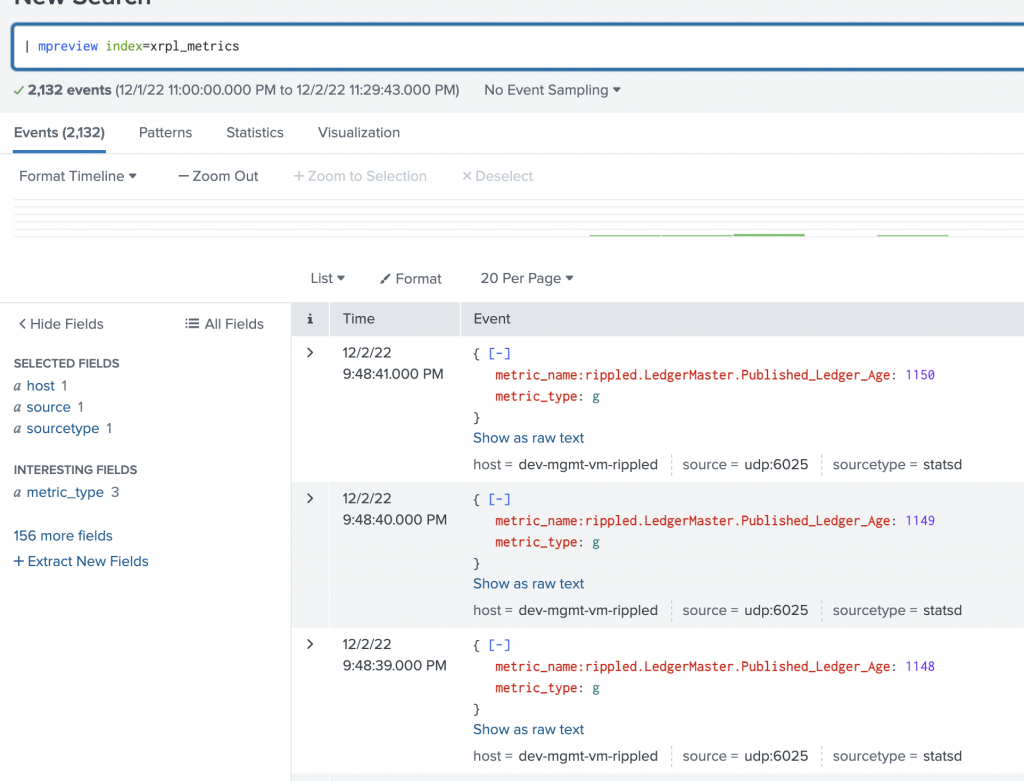
You will notice that metric_name also includes rippled as we have provided it as a suffix in the rippled.cfg
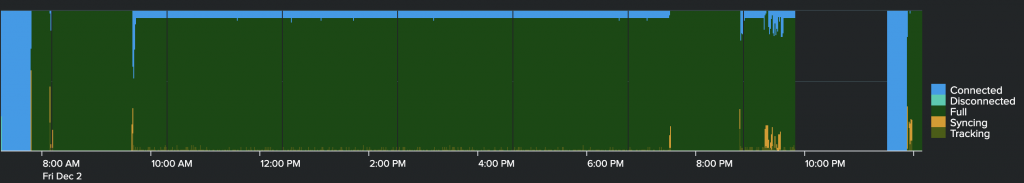
One of the interesting metrics is the rippled.State_Accounting.*_duration which shows you how long the rippled server was in a certain state.
What is convenient is that only the metric that reflects the current state is reported in any given time (in StatsD).
So you can easily create a dashboard panel that shows you which state was your rippled server over a period of time.
| mstats count("rippled.State_Accounting.*_duration") as * WHERE "index"="xrpl_metrics" span=1m