Notes from SplunkLive! Sydney 2019
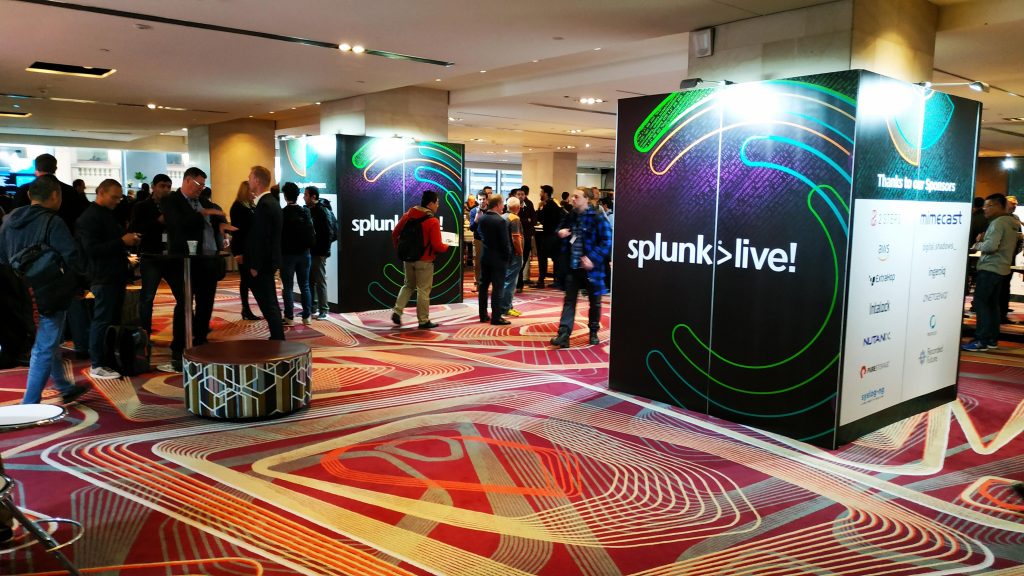
I’ve had a chance to got SplunkLive! in Sydney this year.

It was freezing (by Sydney standards) 7.6 with winds which felt like -0.2 according to weatherzone app on my phone and my face.
So I wouldn’t have minded if the event turned out to be a total disaster, as long as they would have served coffee and it was warm inside, but it turned out to be quite interesting.
DISCLAIMER: This is my personal comprehension (which could still be a bit damaged by the morning cold) of the material delivered there
First Simon Eid (Area Vice President, ANZ, Splunk) and Naman Joshi (Senior Manager Sales Engineering Manager, Splunk) talked about how much Splunk has grown in Sydney and globally.
According to them (and from a few other talks and over the beer conversations during that day) Splunk Sydney has grown from about 17 People 4 years ago to about 180 and Splunk Live Sydney from 40 to more then 700 attendees.
Splunk is growing globally as well with their biggest customer has increased their ingestion rate from “modest” 100TB of data per day to now around 7 petabytes (yes PETA as a 1000 TB) while keeping it for 2 years.
Splunk now wants (and wants us) to consider itself a Data Platform
Simon O’Brien (Principal Sales Engineer, Splunk) had a great demo that started from basic explanation what machine data followed by how it can be searched in Splunk, how Splunk Security can detect suspicious activity and how can Phantom be used to remediate this Security Incident.
After a shot coffee break 4 Splunk customers showed how they have used the tool in their organisations. It was really interesting to see as each use case and road was different
First was Henning Sievert (Principal Software Engineer, Qantas) and he talked how they are using Splunk to operate and monitor Qantas Flight Planning Engine (FPE). FPE is used to create Flight Plans (6000 of them per week in FY16), it calculates the optimal path, required fuel and payload as well as flight time while taking into consideration: weather, airspace and routes, diversions, aircraft performance and other factors. Being such a complicated in-house application it requires a lot test environments and developers. Using Splunk they can see FPE behaviour all the way from DEV to PROD environments as well as can investigate what went wrong when a Flight Plan failed to be generated.
Some takeaways from Henning:
- Design and write your software with Splunk in mind
- Log in an indexable format (key-value pairs, JSON)
- Log with proper use of logging level (so that it will be easier later to present different depth of data do different Splunk users)
- Add metadata to each log entry (e.g. build number, branch, etc.)
- Setup automated alerts
- If you think that your fuel bill is high, think again, Qantas’s one was $3.25B in FY16 🙂
Next was Viktor Adam (Senior Software Engineer, Atlassian)
He is part of the Developer Experience Advocates team and responsible for improving developer satisfaction and what developers were mostly dissatisfied with was the long build time for their Java code.
His team started using maven-profiler to get the details and initially were sending the collected metrics to Datadog. While this has given some insights, the metrics were aggregated and didn’t provide enough actionable information. So they have created a DevMetrics publisher were the maven-profiler will send the metrics and DevMetrics Publisher will send the “raw” metrics to Splunk for analysis and aggregated ones to Datadog.
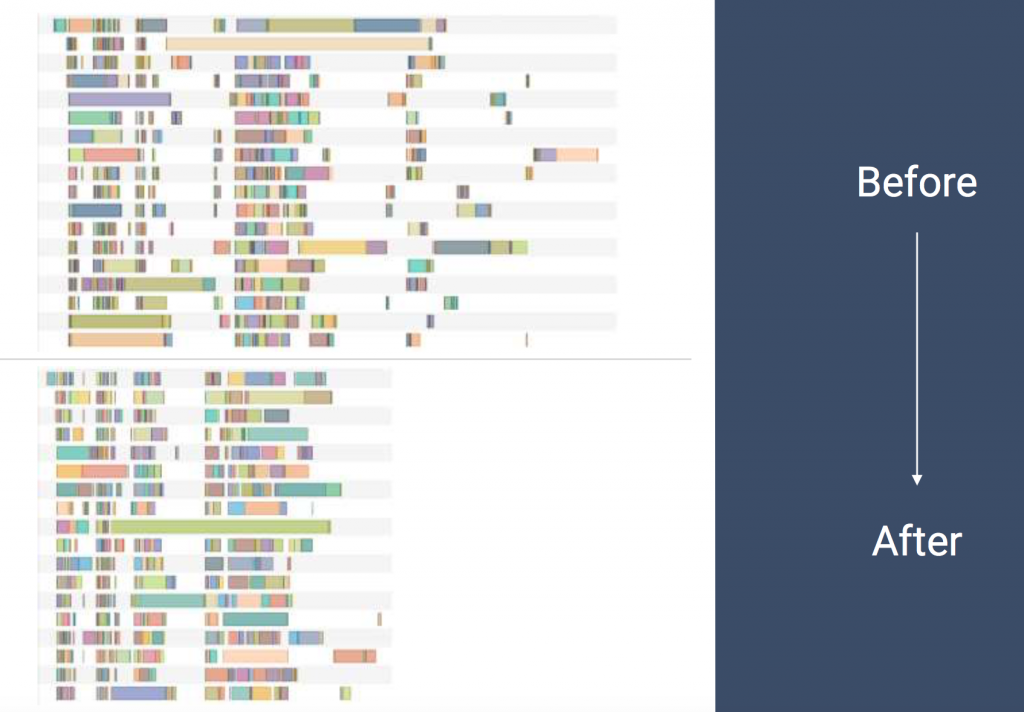
After the build metrics were in Splunk, they’ve used different visualisation techniques to break down the build into smaller pieces as well as rearrange dependencies. As a result the build time was reduced by about 40% from 10:40 to 6:30 minutes.
You can find slides from his talk here https://www.slideshare.net/viktoradam/splunklive-want-to-turbocharge-your-developer-pipeline
Then we had Andrew Jackson (Manager, Linux & AIX, Infrastructure Platforms, NSW Department of Education) talking about their journey with Splunk in the last 8 years. They have started with 20GB/day license in 2011 and now are ingesting 1.3TB/day (proudly the 1st Department of State Government to breach the 1TB/Day ingestion threshold). He has recommended the following 2 Splunk Apps:
- Splunk REST API Modular Input – which allows you to collect data by polling REST APIs
- Data Governance App – which attempts to provide an insight into understanding of access, policies, handling, exposure, and risk in the Splunk environment.
For desert (no actually the last one before the lunch break) we had Frank Flannery (Head of Frontline Technology, NAB). They were tasked to create a single view of Frontline IT services, which are focused around technology in branches, from ATMs to Tellers’ workstations and security cameras and anything in between.
Frank talked how they had to balance between depths and breadth of data. The collected, analysed and presented data needs to broad to provide a holistic view ..“build this out over time”.., while still be deep enough to provide actionable insights …”Avoid simply “nice” data that distracts stuff”..
So they’ve built dashboards for branch mangers where one could see the status off all the critical services within the branch as well as status of the service across the Bank (to avoid “ do you guys also have this issue” calls to neighbouring branches). Same data also aggregated up to the region mangers who could see status across their region.
In addition to having the current data, they have also started playing with Machine Learning capabilities to help answer different question, like “when am I going run out of cash in this ATM?”
After lunch break Simon Trilsbach (Managing Director,2Steps) delivered the “Experience Automation for Splunk” presentation, 2steps.io is a new tool that is tightly integrated with Splunk and it allows you to record and replay Synthetic User Experience Scripts and analyse the performance metrics of these transactions all without leaving the Splunk user interface.
Then there were multiple tracks. The sessions that I’ve attended were:
“Splunk & Multi-Cloud” – Jag Dhillon (Staff Sales Engineer, Splunk) talked about how an organisation could use Splunk in their journey to the cloud. Some of the use cases for Splunk there are:
- Comparing performance metrics from the applications before and after migration to the cloud (or while they are running side-by-side)
- Using Splunk native add-ons to grab data from your Cloud and SaaS providers, like cloud costs or usage reports.
Then we had a very energetic presentation with a a lot of K.I.S.S.es (keep it simple stupid) by Dave Rea about “Worst Splunk Practices & How You Can Fix Them”
It was a shortened, 22 slide long (if I recall correctly), version and I can’t wait to get my hands on the promised full presentation.
Some takeaways for now:
- Don’t use Heavy Forwarders, unless you have to (for things like modular inputs)
- Don’t let Splunk guess your data’s sourcetype – specify it in inputs.conf
- Don’t let events reach your “main” index, it is searched by default. Since a lot of Add-ons send data to main by default, make sure to reconfigure them to send it to the correct index
- Transactions – unless you really need all the data from each step in the correct order, don’t use it. Stats command can get the work done in many cases and it is a lot faster
- RBAC – Choose the right method
- Extremely sensitive – consider a separate Splunk instance
- Legal or Compliance – consider at index level
- Security access control only – consider the app level restrictions
The last session before the drinks going home was “Analytics Through the DevOps Lifecycle” by Jeff Chau (ITOA/DevOps SME Sales Engineer, Splunk). Jeff talked about BizDevSecOps lifecycle and how each stakeholder needs specific data from this continuous loop. He has advocated usage of Splunk HTTP Events Collector (HEC) as it makes easy for developers to send data from different tools in the BizDevSecOps tool belt to Splunk. He also demoed HEC functionality by scraping some OzBargain entries using Python Beautiful Soup library and sending them to Splunk HEC.
Related posts about Splunk
Add new LLM models to Splunk MLTK
Predicting multiple metrics in Splunk
Splunk Failed to apply rollup policy to index… Summary span… cannot be cron scheduled
How to collect StatsD metrics from rippled server using Splunk
Plotting Splunk with the same metric and dimension names shows NULL
Splunk Eventgen Jinja templating
How to Register to Splunk Partner Portal and transfer Certifications and Learning