I wanted to play a little with Grafana while having Elasticsearch as a back-end and decided to use Elastic Heartbeat as my data generator. It’s an easy, no fuss, to set up the Heartbeat itself as well as the first Heartbeat HTTP monitor, but when I saw all the available Heartbeat time metrics for the HTTP monitor I got a bit overwhelmed. So decided to to gradually progress from ICMP through TCP and finally to HTTP Heartbeat monitors and that the way this post is going to evolve as well:
- Part 1 – Elasticsearch Heartbeat ICMP time metrics
- Part 2 – Elasticsearch Heartbeat TCP time metrics (work in progress)
- Part 3 – Elasticsearch Heartbeat HTTP time metrics (work in progress)
Monitors Configuration In order to understand the Heartbeat ICMP monitor time metrics I’ve set up a simple monitor, that “pings” localhost and 127.0.0.1. You might say: “Wait a second, aren’t these that same?”, but you will see the reason why I set it up this way soon. You can see the extract from the heartbeat.yml configuration file relevant to the ICMP monitor
- type: icmp

  # List or urls to query
  hosts: ["localhost", "127.0.0.1"]

  # Configure task schedule
  schedule: '@every 60s'

  # Configure IP protocol types to ping on if hostnames are configured.
  # Ping all resolvable IPs if `mode` is `all`, or only one IP if `mode` is `any`.
  ipv4: true
  ipv6: false
  mode: all

  # Total running time per ping test.
  timeout: 16s

  # Waiting duration until another ICMP Echo Request is emitted.
  wait: 1s
The data returned by the monitors After letting it run for a while let’s check what data Heartbeat is sending to Elasticsearch For the 127.0.0.1 monitor
{
  "@timestamp": "2017-10-17T05:36:25.687Z",
  "beat": {
    "hostname": "DESKTOP-123456",
    "name": "DESKTOP-123456",
    "version": "5.6.1"
  },
  "duration": {
    "us": 0
  },
  "icmp_rtt": {
    "us": 0
  },
  "ip": "127.0.0.1",
  "monitor": "icmp-ip@127.0.0.1",
  "type": "icmp",
  "up": true
}
For the localhost monitor
{
  "@timestamp": "2017-10-17T05:36:25.687Z",
  "beat": {
    "hostname": "DESKTOP-123456",
    "name": "DESKTOP-123456",
    "version": "5.6.1"
  },
  "duration": {
    "us": 1007
  },
  "host": "localhost",
  "icmp_rtt": {
    "us": 501
  },
  "ip": "127.0.0.1",
  "monitor": "icmp-host-ip4@localhost",
  "resolve_rtt": {
    "us": 506
  },
  "type": "icmp",
  "up": true
}
Time metrics We can see that there are only 3 values that have are measured “us” (which suggest that these are time metrics)
- duration
- resolve_rtt
- icmp_rtt
After going through some Elasticsearch Heartbeat docos that’s what I came up with:
duration – Total monitoring test duration
As I understand, it includes the time that Heartbeat actually reads the the monitor definition, executes it and has the final results
resolve_rtt – Duration required to resolve an IP from hostname
Since the first thing that Heartbeat needs to do is to understand which IP you want it to “ping” it tries to translate the hostname you’ve provided to a valid IP. By the way, if you are to provide an IP in the monitor settings, this step will not be require and the metric will exist no more.
icmp_rtt – ICMP Echo Request and Reply round trip time
The actual round trip time of the monitor. The timing starts the moment the client sent the request, and ends when it receives a reply from the server, so basically it includes network time (in each direction) + server time.
Visualization
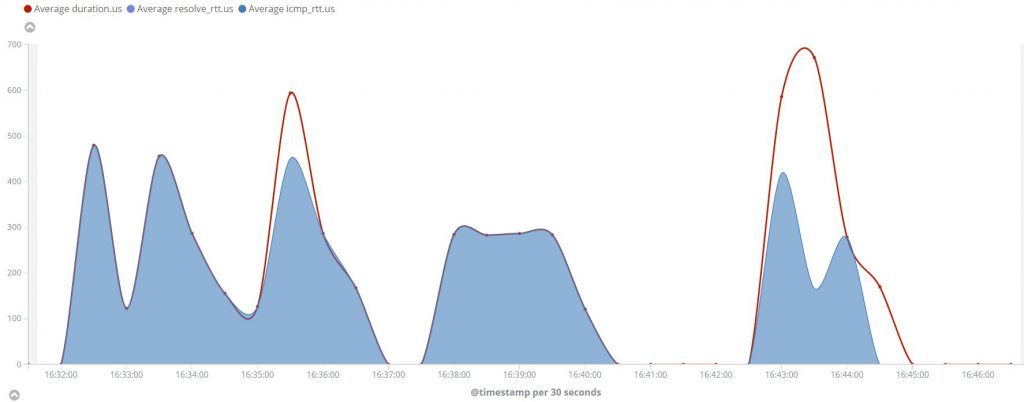
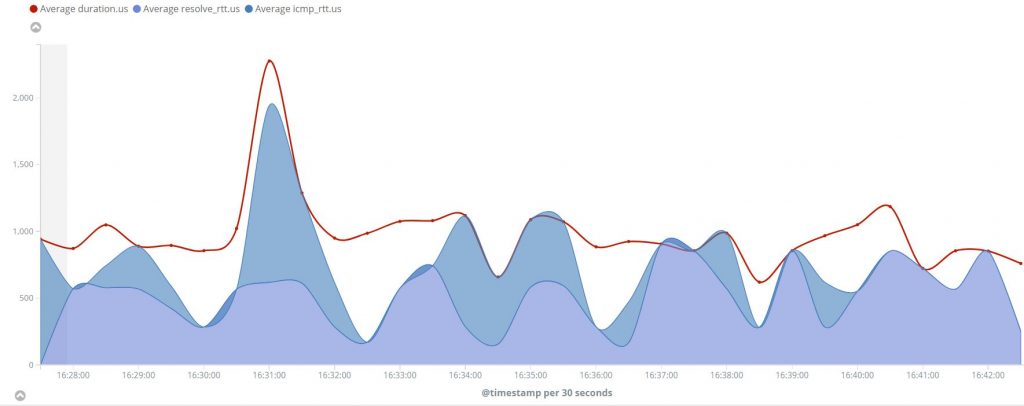
As a bonus for those who have read it so for here are some nice shiny Kibana graphs to visualize the Heartbeat ICMP monitor duration metrics


As you can see in the first graph we didn’t have the resolve_rtt metric since we were “pinging” a known IP, while in the second graph it appears since Heartbeat ICMP monitor needs to resolve the “localhost” to an IP.
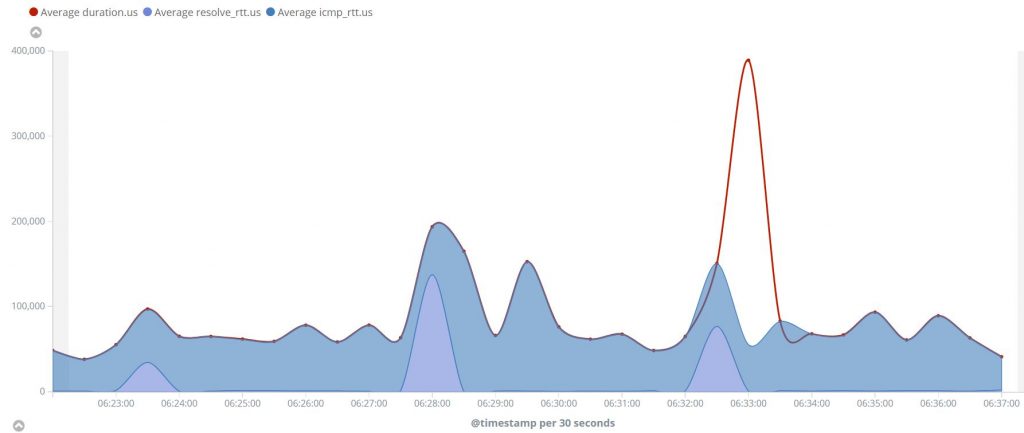
Below is a visualization of a “ping” to google.com so and you can see that resolve_rtt would in “real life” be only a small fraction of the total duration (vs localhost scenario)
In Part 2 I will go over the Elastic Heartbeat TCP Monitor time metrics and finally Part 3 will look into the HTTP ones
Please leave your comment if you think that anything is missing.

Hey,
Thank you for this blog post, looking forward to part 2 and 3.
Grtz
Willem
Thank you for the feedback Willem.
I kind of have most of the details written for these, but didn’t have time to put it in a post and add pretty pictures.
what are the steps used to calculate monitor.us value. How its get calculated. I gone through docs of heartbeat but can’t find a solution
Is it a time to read the monitor definition, then how its get read and generate the value..
Hi Steven,
That’s my understanding as well, as I wrote above:
“…duration – Total monitoring test duration
As I understand, it includes the time that Heartbeat actually reads the the monitor definition, executes it and has the final results…”
Regards,
ILYA Reshetnikov
Where is part 2 and part 3. I tried searching on this website but can’t find it
I kind of got sidetracked to other stuff, still hope to write them some day 🙂
Hi Steven,
Part 2 is here https://isbyr.com/understanding-elastic-heartbeat-time-metrics-tcp/
How do you see the data returned by the monitor. I visualized it on kibana only. Is there any other way to see it.
Hi Steven,
You will be able to see the data returned by the monitor on under logs folder of you Elastic Heartbeat installation folder.
You will need to enable debug logging level in the heartbeat.yml file by uncommenting the following line:
#logging.level: debugRegards,
ILYA
Very nicely written and thanks for taking the time to explain
Thank you for the feedback Ravi.