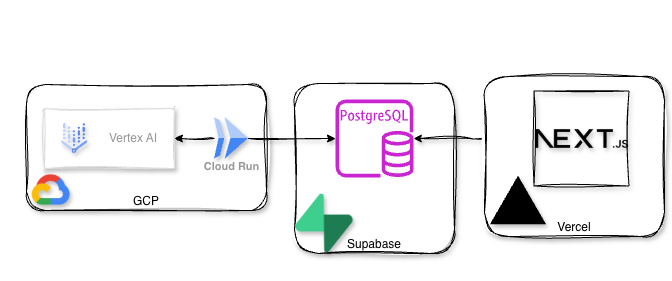
I have a little project I’m working on playing with, MentionVault.com. It’s a platform that allows you to look for guests on various podcasts and what was mentioned in each episode. So I was thinking, I can’t be that shoeless cobbler, how come I have an application and don’t have any Observability for it?! That’s how I decided to try a Splunk O11y deployment for my app.
Tag Archives: Monitoring
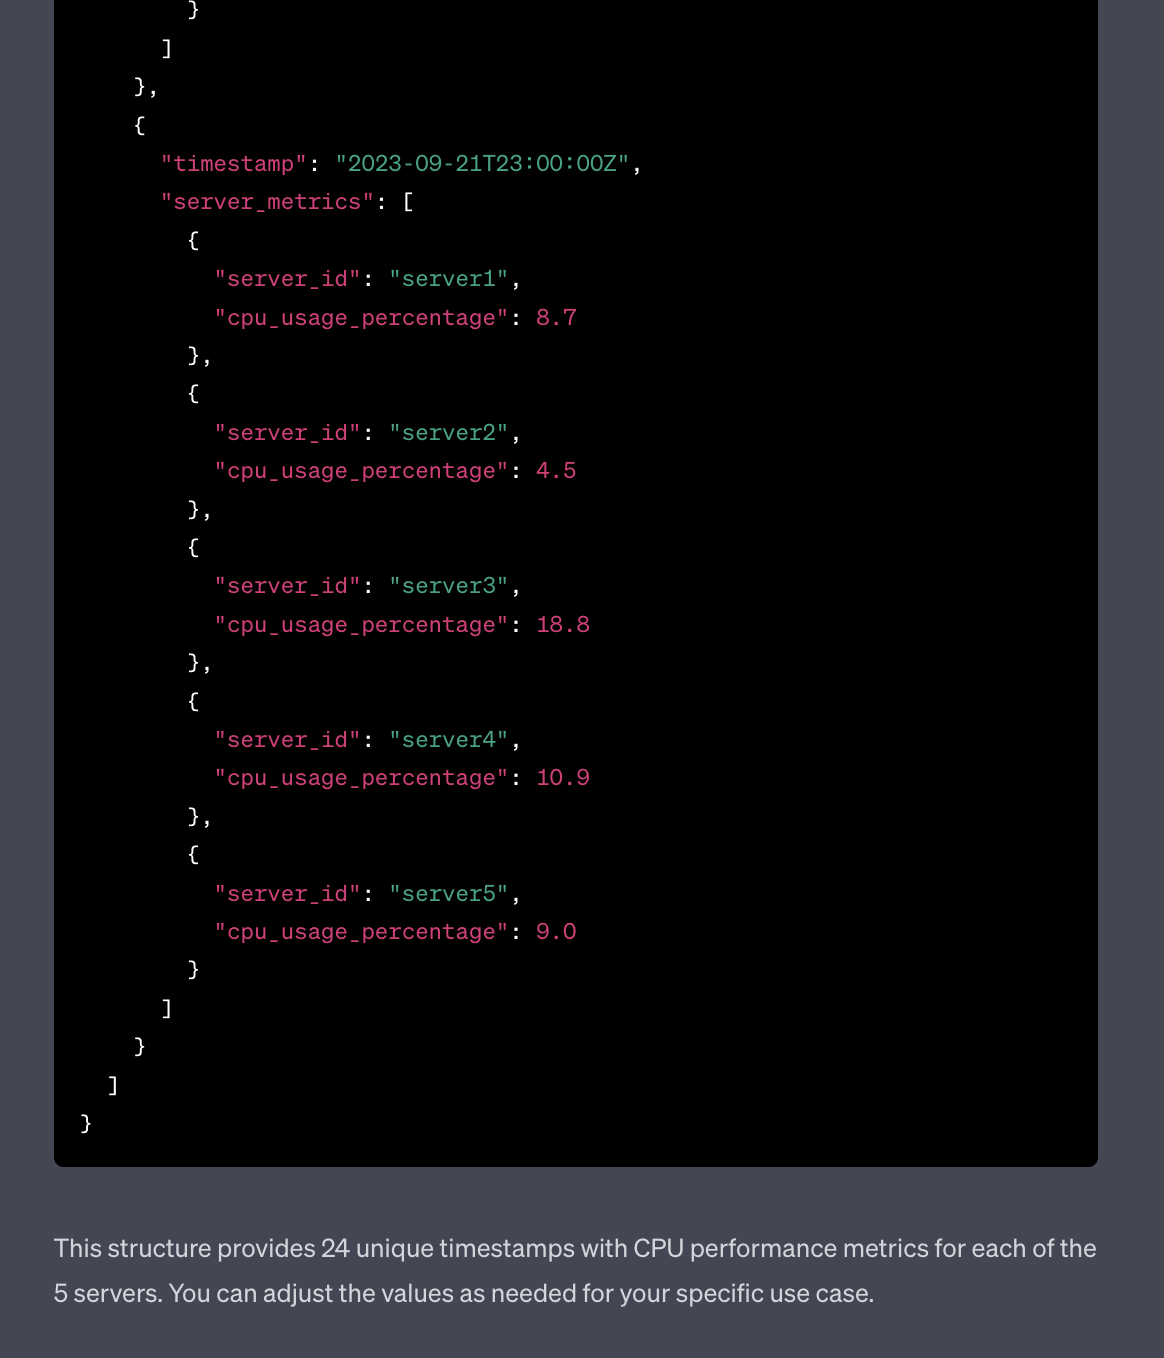
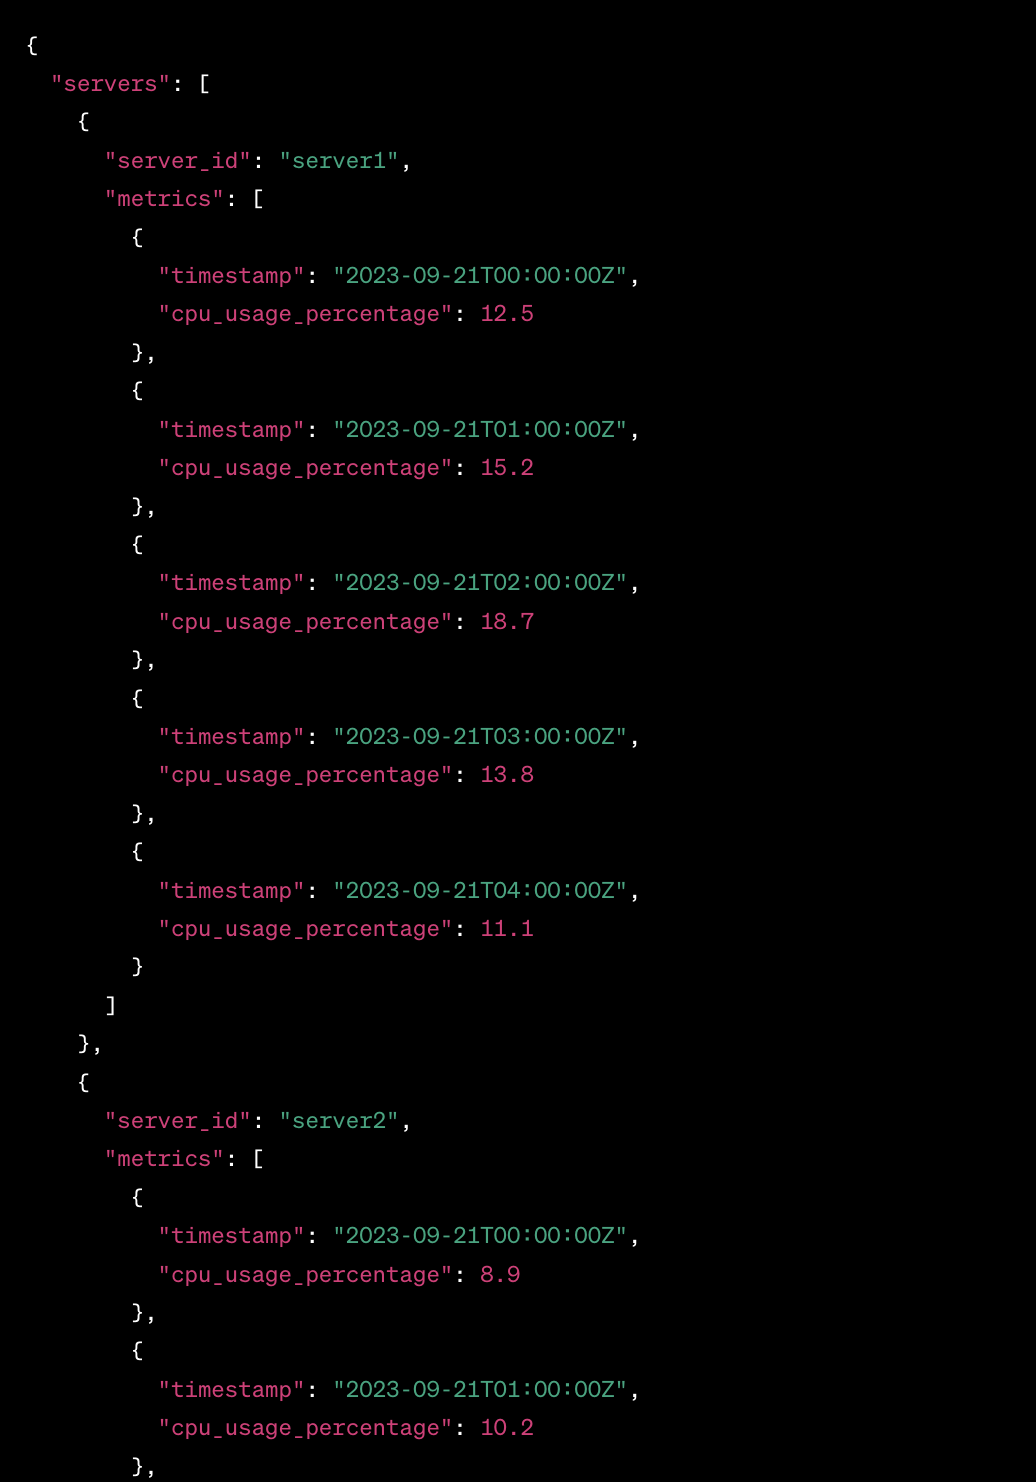
Use ChatGPT to generate sample monitoring data
I wanted to get some sample data and was too lazy to use generators or to craft it by hand, so I decided to try and use ChatGPT to generate sample monitoring data.
Started with this prompt
act as an application and infracture monitoring platform synthetic data generator. All you responses need to be in a valid JSON format.
Generate CPU performance metrics for 5 servers over last 24 hours
The result was actually OK
Understanding Elastic Heartbeat time metrics – TCP
Following on the part I of this series that discussed ICMP, the focus of this post is the Elastic Heartbeat time metrics – TCP Monitors. Continue reading Understanding Elastic Heartbeat time metrics – TCP
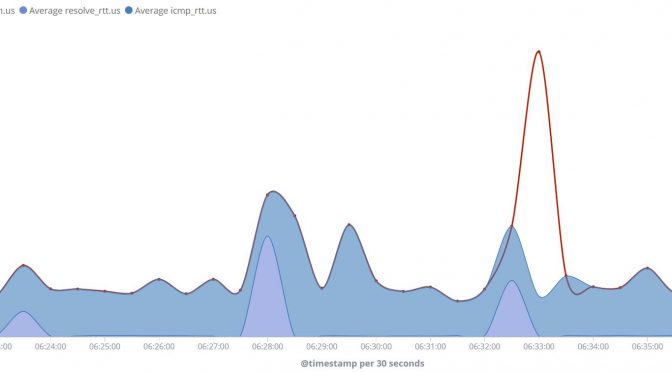
Understanding Elastic Heartbeat time metrics – ICMP
I wanted to play a little with Grafana while having Elasticsearch as a back-end and decided to use Elastic Heartbeat as my data generator. It’s an easy, no fuss, to set up the Heartbeat itself as well as the first Heartbeat HTTP monitor, but when I saw all the available Heartbeat time metrics for the HTTP monitor I got a bit overwhelmed. So decided to to gradually progress from ICMP through TCP and finally to HTTP Heartbeat monitors and that the way this post is going to evolve as well:
- Part 1 – Elasticsearch Heartbeat ICMP time metrics
- Part 2 – Elasticsearch Heartbeat TCP time metrics (work in progress)
- Part 3 – Elasticsearch Heartbeat HTTP time metrics (work in progress)
Continue reading Understanding Elastic Heartbeat time metrics – ICMP