Splunk O11y Deployment

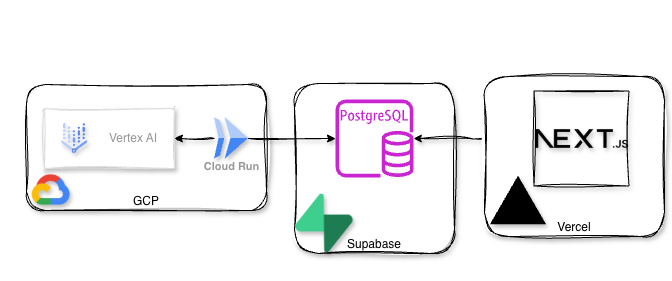
I have a little project I’m working on playing with, MentionVault.com. It’s a platform that allows you to look for guests on various podcasts and what was mentioned in each episode. So I was thinking, I can’t be that shoeless cobbler, how come I have an application and don’t have any Observability for it?! That’s how I decided to try a Splunk O11y deployment for my app.

MentionVault’s Architecture

MentionVault High Level Achitecture

The front end of my app (the website) is a nextJS running on Vercel, the database is Supabase, batch (Python jobs) that populate the database are GCP cloud functions, and in one of them I’m using Google Vertex AI (for extractions of the mentions from the episodes metadata)…. hey look, I start to look like a proper enterprise with stuff deployed all over he place!

Observability Overview

Splunk O11y terminology is somewhat confusing, so here is what we will be deploying for each component:

Application ComponentSplunk ComponentMethod
GCP Run Functions executionsSplunk Infrastructure MonitoringGCP Infrastructure
Digital ExperienceSplunk O11y Real User Monitoring (RUM)splunk/otel-web node package
NextJS FrontendSplunk O11y Application Performance Monitoring (APM)splunk/otel node package
vercel/otel node package
GCP Run Functions instrumentationSplunk O11y Application Performance Monitoring (APM)splunk/otel python package
GCP SchedulerTBC

I tried to stick to the default Splunk O11y Open Telemetry (OTEL) packages, but as you will see, that didn’t always work (for my use case).

First things first, get your hands on a 14-day Splunk O11y trial at https://www.splunk.com/en_us/download/o11y-cloud-free-trial.html

Once you log in…. and it’s a blank canvas (see note below), so let’s start painting.

Note: Don’t be alarmed if at the start (before you bring any data), the UI looks very bare and you kind of think to yourself, “where is all the shiny stuff?”. It’s by intention, the approach that Splunk O11y team took: “We will start showing you widgets once we have the data to power them!”.

GCP Infrastructure

In a nutshell, Splunk O11y will pull all the metrics from the GCP Monitoring API. To configure it, start the wizard from the UI by navigating to Data Management > Available Integrations > (search for “gcp”) > Google Cloud Platform.

Splunk O11y Infrastructure Monitoring Available Integrations

By following the instructions in the wizard, you will provide information like the authentication method, the GCP project ID, and which data you want to collect, and in exchange, the wizard will tell you which commands you need to run in the GCP console shell or on your laptop (if you have gcloud CLI installed).

Remember that I told you that Splunk O11y will pull ALL the metrics from GCP Monitoring API?! It definitely will! If in the wizard, you are too lazy to pick and choose specific services and just ask for “the lot”, you might end up pulling and PAYING too much.

As you can see above, I did ask for “the lot”, and in a couple of late hours on the first day, Splunk O11y made about 3 times the number of metric calls compared to what it does now on a daily basis.

Anyway, after completing the wizard and manually triggering GCP Run functions (I didn’t want to wait for their next scheduled runs), the dashboards came to life.

As it is part of Splunk Infrastructure Monitoring, you will see all the “infrastructure” metrics, like the number of requests to these functions, CPU and Memory utilisation, etc.. You will not be able to peek “inside” the functions into the Python code to see where the time is being spent (that part we will do later during an APM deployment phase).

Real User Monitoring (RUM)

After having my infrastructure covered by the Splunk O11y Infrastructure Monitoring, I jumped to configure RUM for my front-end.

The way Splunk O11y (or most of the other vendors’) RUM works is by injecting a piece of JavaScript code into the web page so that when a page is loaded, this piece of code collects a bunch of data (like what you clicked, how long did it take for the page to load, etc.) and sends all that valuable information to the analytics platform (Splunk O11y in our case).

To configure RUM in Splunk O11y, you need to obtain a token from: Settings > Access Tokens > Create Token. Make sure to select “RUM token” in the wizard.

Splunk O11y Cloud Create new access token wizard

In the next step, if needed, you can adjust permission (as to who can view the token value) and finally set the token expiration date (default is 30 days, and the maximum is 18 years).

If the new token doesn’t appear on the Access Tokens page straight away, just refresh the page.

On this page, you can see all the tokens with their expiration date (which conveniently highlights if a token is about to expire

Splunk O11y Cloud Access Tokens page

After the token is created, you can start the RUM onboarding wizard by navigating to Data Management > Available Integrations > (search for “rum”) > Browser Instrumentation.

Splunk O11y Cloud Available Integrations - RUM

The Wizard will ask you what RUM token to use, the name of your application and the deployed environment. It will then provide you with the deployment steps based on your deployment/architecture (CDN / self-hosted / NPM). NPM was my choice.

Splunk O11y Cloud RUM Wizard

Note: You can also deploy the Session Replay functionality, but I’ve skipped it for the moment.

Running the suggested npm install @splunk/otel-web --save will install the required package(s), and will also update your package.json and package-lock.json.

package.json

As you can see, the suggested version of splunk-instrumentation.js had hardcoded values (that are either sensitive and/or expected to change from one deployment environment to another)

import SplunkOtelWeb from '@splunk/otel-web';
SplunkOtelWeb.init({
   realm: "au0",
   rumAccessToken: "Super_Secret_Token",
   applicationName: "MentionVault",
   deploymentEnvironment: "DEV"
});

I Codex (after my guidance), improved it by taking out the hardcoded values from the code into environment variables, so now it looks like that

import SplunkOtelWeb from '@splunk/otel-web';

const rumAccessToken = process.env.NEXT_PUBLIC_SPLUNK_RUM_ACCESS_TOKEN;
const deploymentEnvironment = process.env.NEXT_PUBLIC_DEPLOYMENT_ENVIRONMENT;

if (typeof window !== 'undefined') {
  if (!rumAccessToken) {
    console.warn('Splunk RUM access token is not set; skipping instrumentation.');
  }
  else {
    SplunkOtelWeb.init({
        realm: 'au0',
        rumAccessToken,
        applicationName: 'MentionVault',
        deploymentEnvironment,
    });
  }
}

To load it, a small component components/splunk-rum.tsx was created

'use client'

import '@/splunk-instrumentation'

export function SplunkRum() {
  return null
}

and it was then added at the top of the app/layout.tsx.

layout.tsx with Splunk O11y RUM component

After updating the local environment values, restarting the local Next.js server and browsing the (local) website, the Digital Experience dashboards came to life

Splunk O11y Cloud RUM Overview page

You can even see here some JavaScript errors that were happening while I was trying to convert hard-coded values into the env vars.

The sessions are also captured, including the waterfall of what was loaded and clicked on each page.

Splunk O11y Cloud RUM Session Timeline

That’s cool, but wait! How do I deploy Splunk O11y RUM to my NextJS, Vercel-hosted environment(s)? Turns out, pretty easy!

Assuming you already had Vercel configured to build your site from the GitHub repo (and why wouldn’t you?), all that is needed to be done is to add the environment variables to Vercel, and then push your local code to one of the branches in GitHub that is “monitored” by Vercel pipelines.

Note: Make sure to specify different values for the NEXT_PUBLIC_DEPLOYMENT_ENVIRONMENT variable in each Vercel environment.

Vercek Add Environment Variable page

And like that, the Tag Spotlight dashboard started having a bit more colours, and it shows requests from my local environment as well as from the preview and production Vercel-hosted ones.

Splunk O11y Cloud RUM Tag Spotlight page

APM

While RUM provides insights into how real users experience your application, it doesn’t reveal how the (web) server spends its time serving each page request.

APM instrumentation augments either the execution of the code or the code itself.

The first approach is zero-code (A.K.A. automatic) instrumentation, where commonly used libraries (such as requests in Python) are replaced at runtime with instrumented versions. Although no code changes occur when your code calls these libraries, the instrumented versions collect and export telemetry data.

The second approach is code-based instrumentation, where developers use OpenTelemetry (in our case) or vendor-specific, language-specific libraries to instrument their code at key points to generate the required telemetry data.

My preference is to use the first approach, but let’s see how we go.

One more caveat: usually the APM instrumented applications will send their OTEL data to an OTEL collector (for filtering, enrichment, routing, etc.) that in turn will forward the data towards the analytics platform (like Splunk O11y Cloud), but since I am relying on managed services for my application (Vercel and GCP Cloud Run) I didn’t have any infrastructure to deploy the collector, so I am trying to send the data directly to Splunk O11y Cloud APM.

Front-End Instrumentation

Create a new Access token following steps similar to the ones described in the RUM section, but make sure to select INGEST as the token type. Then kick off the APM onboarding wizard by navigating to Data Management > Available Integrations > (search for “apm”) > Node.js (OpenTelemetry) v3.x.

Splunk O11y Cloud Node.JS APM wizard

When entering the details in the wizard, instead of the default OTEL collector running locally (on the same host as the instrumented app), I needed to provide the Splunk O11y Cloud endpoint. The endpoint is https://ingest.<realm>.signalfx.com/v2/trace, where realm is the “location” of your Splunk O11y deployment that you can get from the URL in the browser.

Side note: I guess signalfx is hard-coded somewhere very deep, if Splunk can’t change the URLs to (or add new) Splunk-branded ones 6 years after the acquisition of SignalFx.

In the next step, the wizard will suggest a set of steps to complete to instrument your app.

Splunk O11y Cloud Node.JS APM wizard recommendation

And here the “Fun” begins…

The first 2 are easy; you simply install the package and add some environment variables for the Splunk OTEL to pick up its configuration.

The 3rd one, however, stumbled me a little bit. Since I am not running a “pure” node application but a Next.js one, I didn’t know what I needed to run (instead of node -r @splunk/otel/instrument <your-app.js>) to start the local Next.js server with Splunk OTEL instrumentation. After a bit of Googling/ChatGPT-ing, I landed on updating my package.json start dev script (note the --require and not -r as well as escaping quotes).

 ...
 "scripts": {
    "build": "next build",
    "dev": "NODE_OPTIONS=\"--require @splunk/otel/instrument\" next dev",
 ...

Restarted the server, browsed my site locally, and…. nothing happens :-(.

Following the suggestion in Splunk docs, I enabled OTEL debugging by adding an OTEL_LOG_LEVEL variable to my start script (actually, I created a new dev-debug one)

...
 "scripts": {
    "build": "next build",
    "dev": "NODE_OPTIONS=\"--require @splunk/otel/instrument\" next dev",
    "dev-debug": "OTEL_LOG_LEVEL=debug NODE_OPTIONS=\"--require @splunk/otel/instrument\" next dev",
...

And of course 🤦‍♂️, I realised that I forgot to add the SPLUNK_REALM and SPLUNK_ACCESS_TOKEN to the environment variables.

Note: I probably missed something else, but if I was using an .env.local file to store the OTEL-related environment variables, they were not picked up (while other ones, like Supabase configuration, were), so I needed to pass the values either via the start script in package.json or via the OS (export SPLUNK_REALM=...).

Restarted Next.JS local server, browsed, and … oh Joy! APM dashboard came to life, I could see Traces, like the one below.

Since I already had Splunk O11y RUM configured, I could also drill down (or is it actually pan out?) to the RUM session that triggered this trace:

Now, after I validated that it is capturing traces, I decided to try and deploy it to Vercel, and here the REAL “Fun” begins…

I made sure to set all the necessary env vars in Vercel, but the deployment was failing. The deployment logs were showing this error:

23:13:45.367 node:internal/modules/cjs/loader:1215
23:13:45.368 throw err;
23:13:45.368 ^
23:13:45.368
23:13:45.368 Error: Cannot find module '@splunk/otel/instrument'
23:13:45.368 Require stack:
23:13:45.368 - internal/preload

But why? But how? @splunk/otel is declared in the package.json, so this module should be installed and available, shouldn’t it?

Turn out (according to ChatGPT):

What’s happening – Vercel sets your NODE_OPTIONS for every Node process it spins up, including the ones it runs before npm install. At that point, node_modules doesn’t exist yet, so –require @splunk/otel/instrument throws MODULE_NOT_FOUND and the build aborts.

How to fix it – Don’t point NODE_OPTIONS directly at the package on Vercel. Instead …”

The “instead” part required a bit of trial and error, but eventually landed on the need to create instumentation.ts

export async function register() {
  if (process.env.NEXT_RUNTIME !== 'nodejs') {
    return;
  }

  try {
    const { start } = (eval('require') as NodeJS.Require)(
      '@splunk/otel',
    ) as typeof import('@splunk/otel');

    const logLevel =
      process.env.NEXT_PUBLIC_DEPLOYMENT_ENVIRONMENT === 'production'
        ? 'info'
        : 'debug';

    start({
      logLevel: logLevel,
    });
  } catch (error) {
    const err = error as NodeJS.ErrnoException;
    if (err?.code === 'MODULE_NOT_FOUND') {
      console.warn('Splunk OTel instrumentation not available yet, skipping preload.');
      return;
    }
    throw error;
  }
}

The deployment worked, but the instrumentation didn’t work. Setting the OTEL_LOG_LEVEL=debug in Vercel also didn’t enhance the Vercel Run logs by a bit.

Interestingly, somewhere along the way, my Traces from my local deployment also started showing calls to the local Supabase instance.

Without access to debug the deployment, I had to give up rethink my approach: what is Vercel’s recommended way of using OTEL?

While Vercel has prebuilt integrations for some APM vendors, Splunk O11y Cloud is not one of them. But fear not! There is a way forward; we can use Custom OTEL Exporters.

So, install Vercel’s OTEL wrapper npm i -E @vercel/otel@1.13.1 .

Note: Make sure to pin the @vercel/otelpackage to the latest 1.x version, as v2 has some dependency conflicts with @splunk/otel-web.

And now create/update instrumentation.ts

import { registerOTel, OTLPHttpProtoTraceExporter } from '@vercel/otel';

export function register() {
  registerOTel({
    serviceName: 'MentionVault',
    traceExporter: new OTLPHttpProtoTraceExporter({
      // Splunk O11y OTLP traces endpoint
      url: `https://ingest.${process.env.SPLUNK_REALM}.signalfx.com/v2/trace/otlp`,
      headers: {
        'X-SF-Token': process.env.SPLUNK_ACCESS_TOKEN!, // ingest token
      },
    }),
    attributes: {
      'deployment.environment': process.env.NEXT_PUBLIC_DEPLOYMENT_ENVIRONMENT ?? 'local',
    },
  });
}

Note: We are using OTLPHttpProtoTraceExporter and not the OTLPHttpJsonTraceExporter (as it appears in the example in Vercel docs) since Splunk O11y Cloud expects the OTLP data in the protobuf (and not JSON) format. After redeploying that to Vercel and browsing the hosted website, traces started streaming to the Splunk O11y deployment, with one caveat – the link between APM and RUM is gone ☹️. I’ll need to spend some time to see if we can bring it back, but that is another item to add to the TODO list.

GCP Cloud Run (Python) Functions Instrumentation

Details to be updated soon….

From a first glance, simply following the wizard works locally

But the fun part will probably be making sure it works in GCP deployment as well….

TO BE CONTINUED….