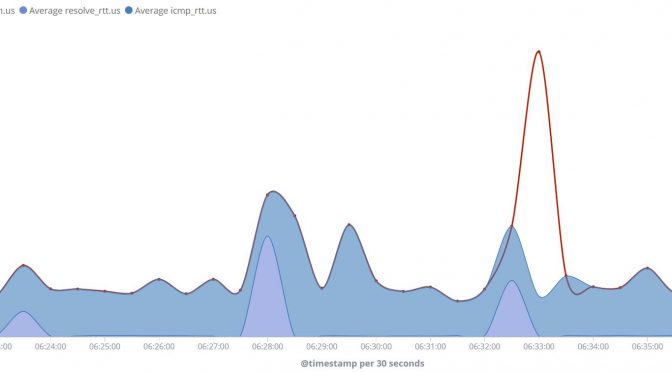
I wanted to play a little with Grafana while having Elasticsearch as a back-end and decided to use Elastic Heartbeat as my data generator. It’s an easy, no fuss, to set up the Heartbeat itself as well as the first Heartbeat HTTP monitor, but when I saw all the available Heartbeat time metrics for the HTTP monitor I got a bit overwhelmed. So decided to to gradually progress from ICMP through TCP and finally to HTTP Heartbeat monitors and that the way this post is going to evolve as well:
- Part 1 – Elasticsearch Heartbeat ICMP time metrics
- Part 2 – Elasticsearch Heartbeat TCP time metrics (work in progress)
- Part 3 – Elasticsearch Heartbeat HTTP time metrics (work in progress)
Continue reading Understanding Elastic Heartbeat time metrics – ICMP
